- 03/20/2017
- Posted by: Mike O'Malley
- Category: country radio programming

by Mike O’Malley
First, “Thank you!” to all who were a part of A&O&B’s 23rd annual Pre-CRS Seminar Wednesday, February 22nd, in Nashville. From our attendees to our presenters to our sponsor BMLG – we appreciate each of you!
As we’ve done for the past 12 years, we presented some top-line data from our just-out-of-the-field online perceptual study: Roadmap 2017. This year’s wonderfully rich report included 11,742 Country Radio Listeners across the US and Canada with 9,138 aged 18-54 – 89% of whom were Country P1s.
For those of you who were unable to join is in person in Nashville, we’re excited about sharing some of the information we presented. We’ll be doing this in installments over the coming weeks.
And for those of you who were able to join us in person, this series will give you an opportunity to revisit some key information designed to help all of us create the best radio we can for our listeners and clients.
Enjoy our first installment: Country Station Satisfaction. And as always, your feedback and thoughts are most welcome.
Country Station Satisfaction:
Here’s some good news. Country Station Satisfaction is up a tick.
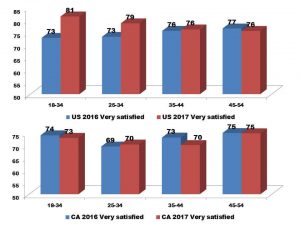
Among our full panel of nearly 12,000 Roadmap 2017 participants, 75% reported being “very satisfied” with their country station. That’s up fractionally from last year’s 74%.
Among 18-54s, 77% of US respondents and 72% of Canadian respondents reported being “very satisfied” with their country stations. This is a slight increase for US stations though a slight decrease for Canadian stations.
We isolated station satisfaction by demo to see if there was difference across demo or change across demo compared to last year. While Canadian respondents’ opinions varied little from 2016, 18-34 US panelists showed a notable increase in satisfaction.

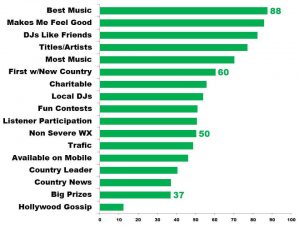
We pursued the satisfaction by asking respondents what station elements/attributes were important to them in choosing one country station over another.
“Plays the best music for my tastes” was number one in importance and across all four demos while “Makes me feel good when I listen” was second.
Here are the 17 attributes we investigated and how each ranked:

There were some interesting differences across demos.
For example, 18-24s ranked Title and Artist Identification higher than 25-54s though this demo placed identifying titles and artists fourth.
Music Quantity was fifth for all cells though in terms of percentages it was of greater importance to 18-34s.
We also asked panelists how their local stations did in satisfying their listeners in these areas. Overall, stations over-performed in “Makes me feel good when I listen” and “DJs that sound like my friends” (indexing at 101 and 106 respectively).
In aggregate stations indexed close to 100 for both music quality and quantity.
Among all 18-54s, most stations over-indexed on the other 8 offered attributes.
We probed the 6% who expressed some level of dissatisfaction (“somewhat dissatisfied” or “very dissatisfied”), why they felt this way. The top three issues for these listeners were, “repeating songs far too frequently,” “too many commercials” and “don’t like the music mix.”
Compared to last year, complaints about song repetition were down in the US (59-54%) and flat in Canada (62-63%). Having issues with the music mix were down in both the US (29-25%) and Canada (30-26) compared to last year. Complaints about commercial load were flat in the US and down in Canada.
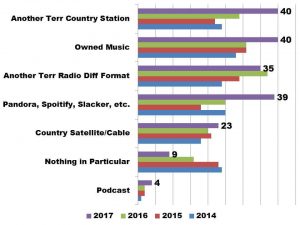
We then asked when dissatisfaction resulted in switching off the station for something else, what (if any) other destination did they most frequently go.
Here’s the four year trend (shown in percentages):

Among the most notable trend is that “Nothing in particular” as a destination continues to fall – now just 9% from close to 25% four years ago suggesting that listeners have increasingly found particular alternatives.
The destinations with the largest growth are services like Pandora and Spotify, owned music, and another AM/FM Country station. As a specific destination, only another AM/FM radio station with a different format declined from last year although that decline was small.
There were differences across demographics. In the US, the top switch-to destination for 18-34s was a service like Pandora or Spotify. 35-44s were equally likely to go there as they were to another AM/FM Country station. Meanwhile for 45-54s another AM/FM Country station was the top destination.
For Canadians, the top 18-34 choice was a streaming service which tied with owned music. Among 35-54s the top destination was another AM/FM Country station or a satellite or cable option with 45-54s also choosing to listen to music they own.
With overall station satisfaction up, asking how music is faring with listeners compared to last year is a logical next question. For both the US and Canada, 2017 saw a change in what had been a several consecutive years of declining “country is the same or better than last year” scores.
And those scores as well as era preferences, music discovery and more are what we’ll dive into in a future post as we go under the hood on Roadmap 2017.
In the meantime, feel free to share your thoughts with us and fellow readers – they’re always valued.
Clients Only: Access the full Roadmap data here.
Photo Copyright: <a href=’https://www.123rf.com/profile_olivier26′>olivier26 / 123RF Stock Photo</a>
