- 04/04/2018
- Posted by: Mike O'Malley
- Category: Uncategorized

“Extrapolations will become a thing of the past.” That’s how Nielsen’s Jon Miller, VP, Audience Insights, sees the impact of “Diary Monthly Radio Insights,” the new service Nielsen rolled out to diary markets last week.
The slug line for this series of reports is “granular insights delivered quickly.”
And that’s pretty much exactly what you get.
I was privy to a live data preview and there IS quite a lot of terrifically helpful, new-to-Arbitrends information that diary markets will love.
There are also several sections that contain data that’s been delivered previously, but is now presented in more user-friendly styles.
The Nielsen Data
The first thing to know is that this is unweighted data (thus the speedy delivery). So it’s probable that there will be some adjustments when the actual monthly trend numbers are released.
However if you’ve tracked your weighted vs. unweighted quarter-hours in the past, you’ll have at least some feel for the degree to which these numbers may (or may not) change.
But you’ll be starting with “real” numbers not a guestimate based on an extrapolation formula. So you’re already well on your way to greater accuracy.
The Reports
There are nine reports and six demo breakouts (including two new ones). Some reports show breakouts for each demo, while other reports are 12+ only or 12+/25-54 only.
Here are the report demos:
- 12+
- 18-39 (new demo)
- 18-49 (new demo)
- 25-54
- Men 25-54
- Women 25-54
Looking at the reports themselves, here are the new tables and data that are included:
- Raw and percentage of 12+ and 25-54 diaries for the current and previous two phases
- Market Composition for the current phase including the percent of the sample vs. the population in age, gender (12+ only) and ethnicity (12+ only)
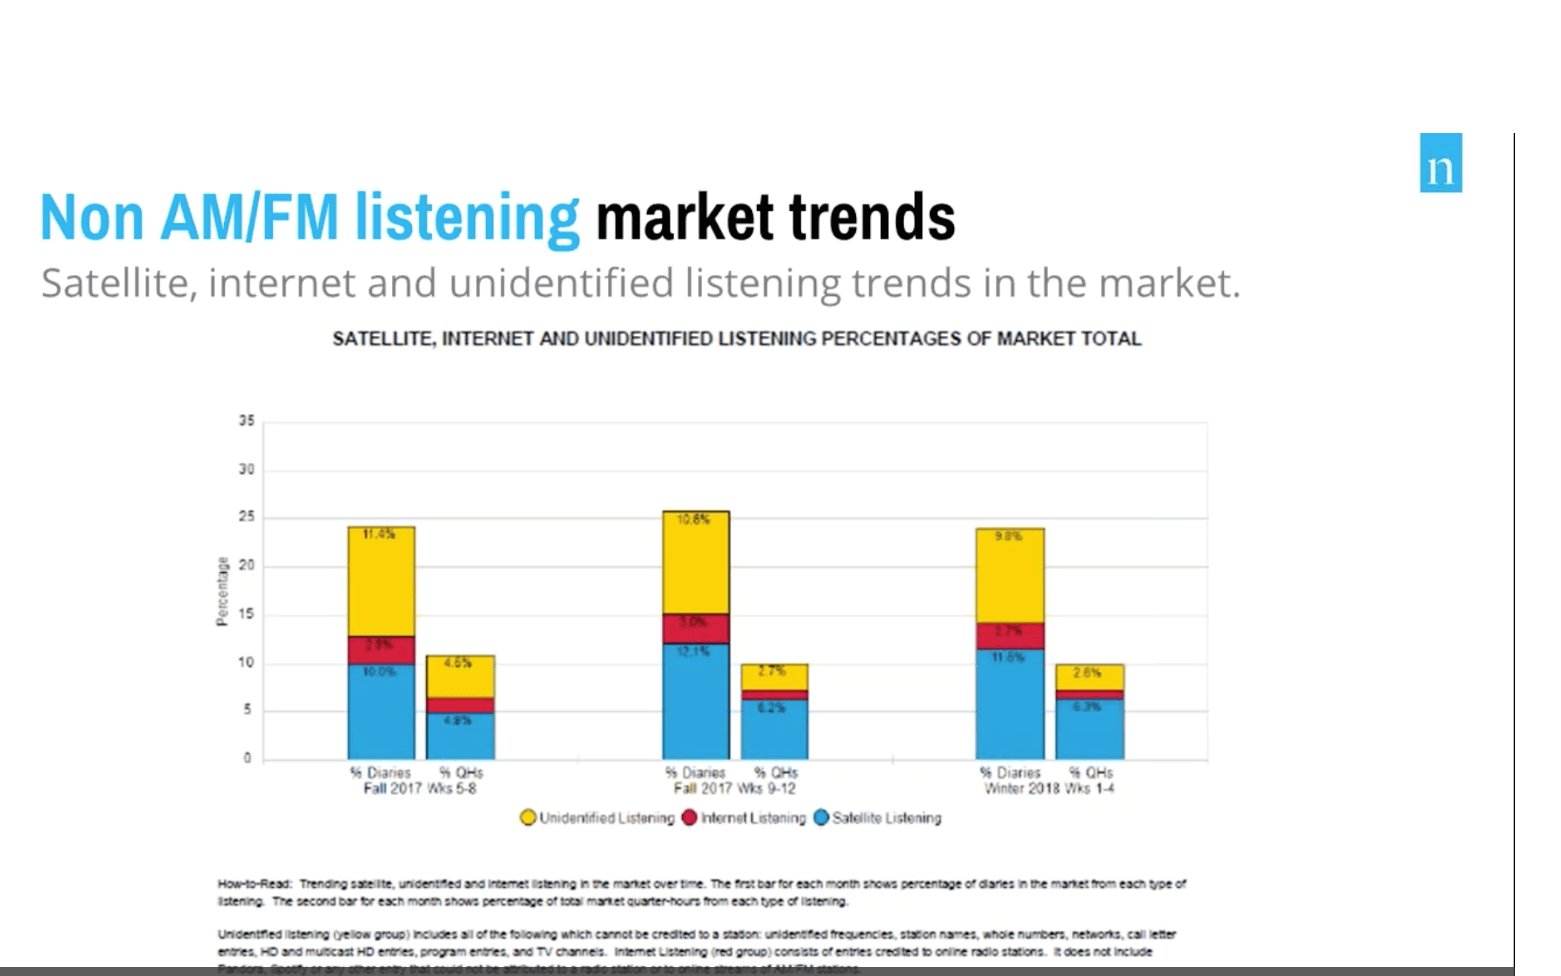
- Satellite, Internet and Unidentified listening; Pure Plays are not included (12+ only)
- Monthly performance by formats in the market (12+ only)
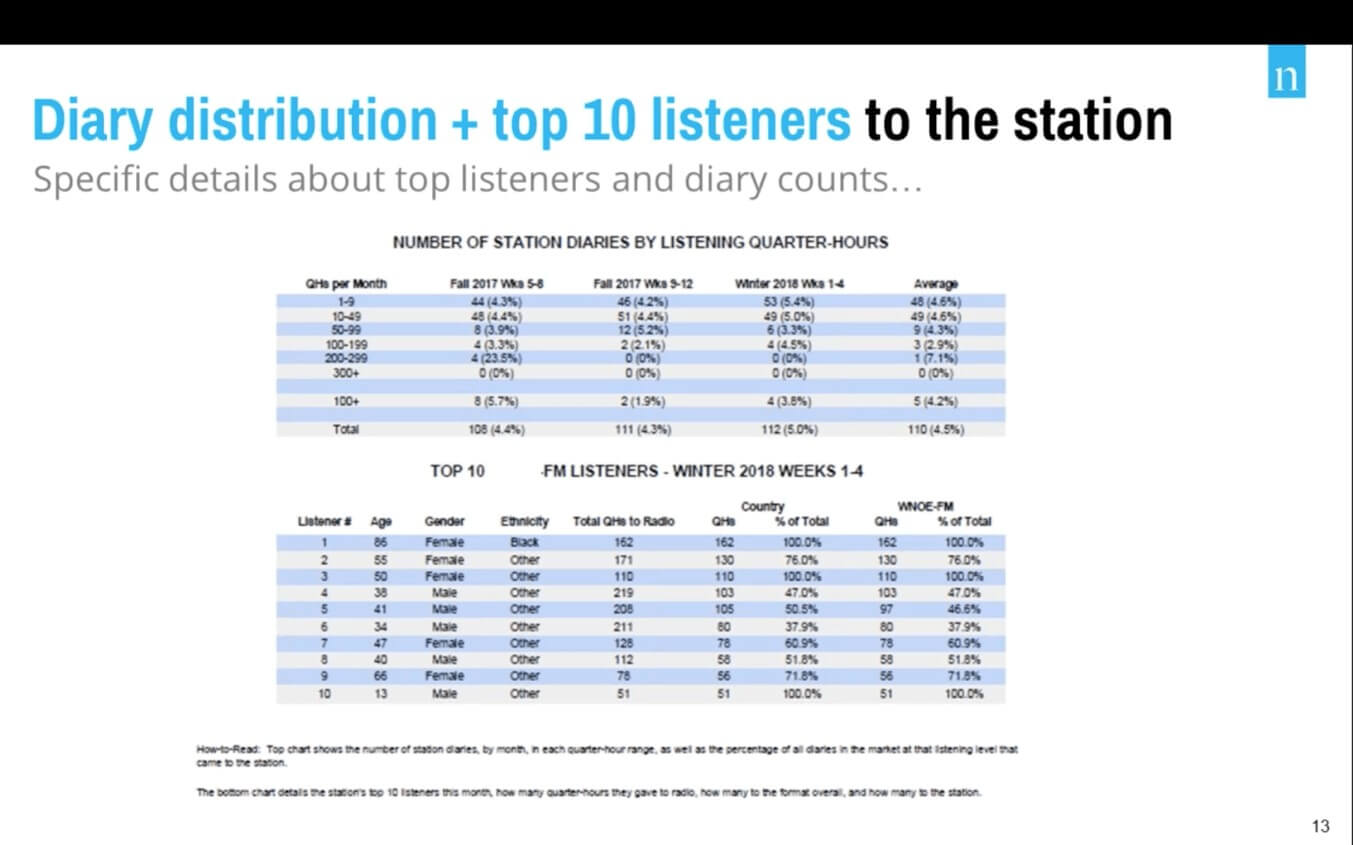
- “100+ QHR” report (12+ only) which includes a type of “who impacted the ratings” report (officially called the “Top 10 Listeners Report”) which lists a station’s top 10 quarter-hour diary keepers. Each diary keeper is identified by age, gender, ethnicity and usage.
- The number of diary keepers and their AQH contributions by discrete age
- A station zip code report that displays both market and station diaries and market and station quarter-hours for (12+ only)
Meanwhile, newly organized/aggregated reports include:
- Quarter Hour Rankers for full week, each major daypart and each major demo
- 13 months of Quarter Hour Trends for each of the six demos
Some of these layouts resemble PPM reports – not surprising since the inspiration for providing this type of granularity to diary markets was the PPM Control Panel Reports.
Station Reports vs. Market Reports
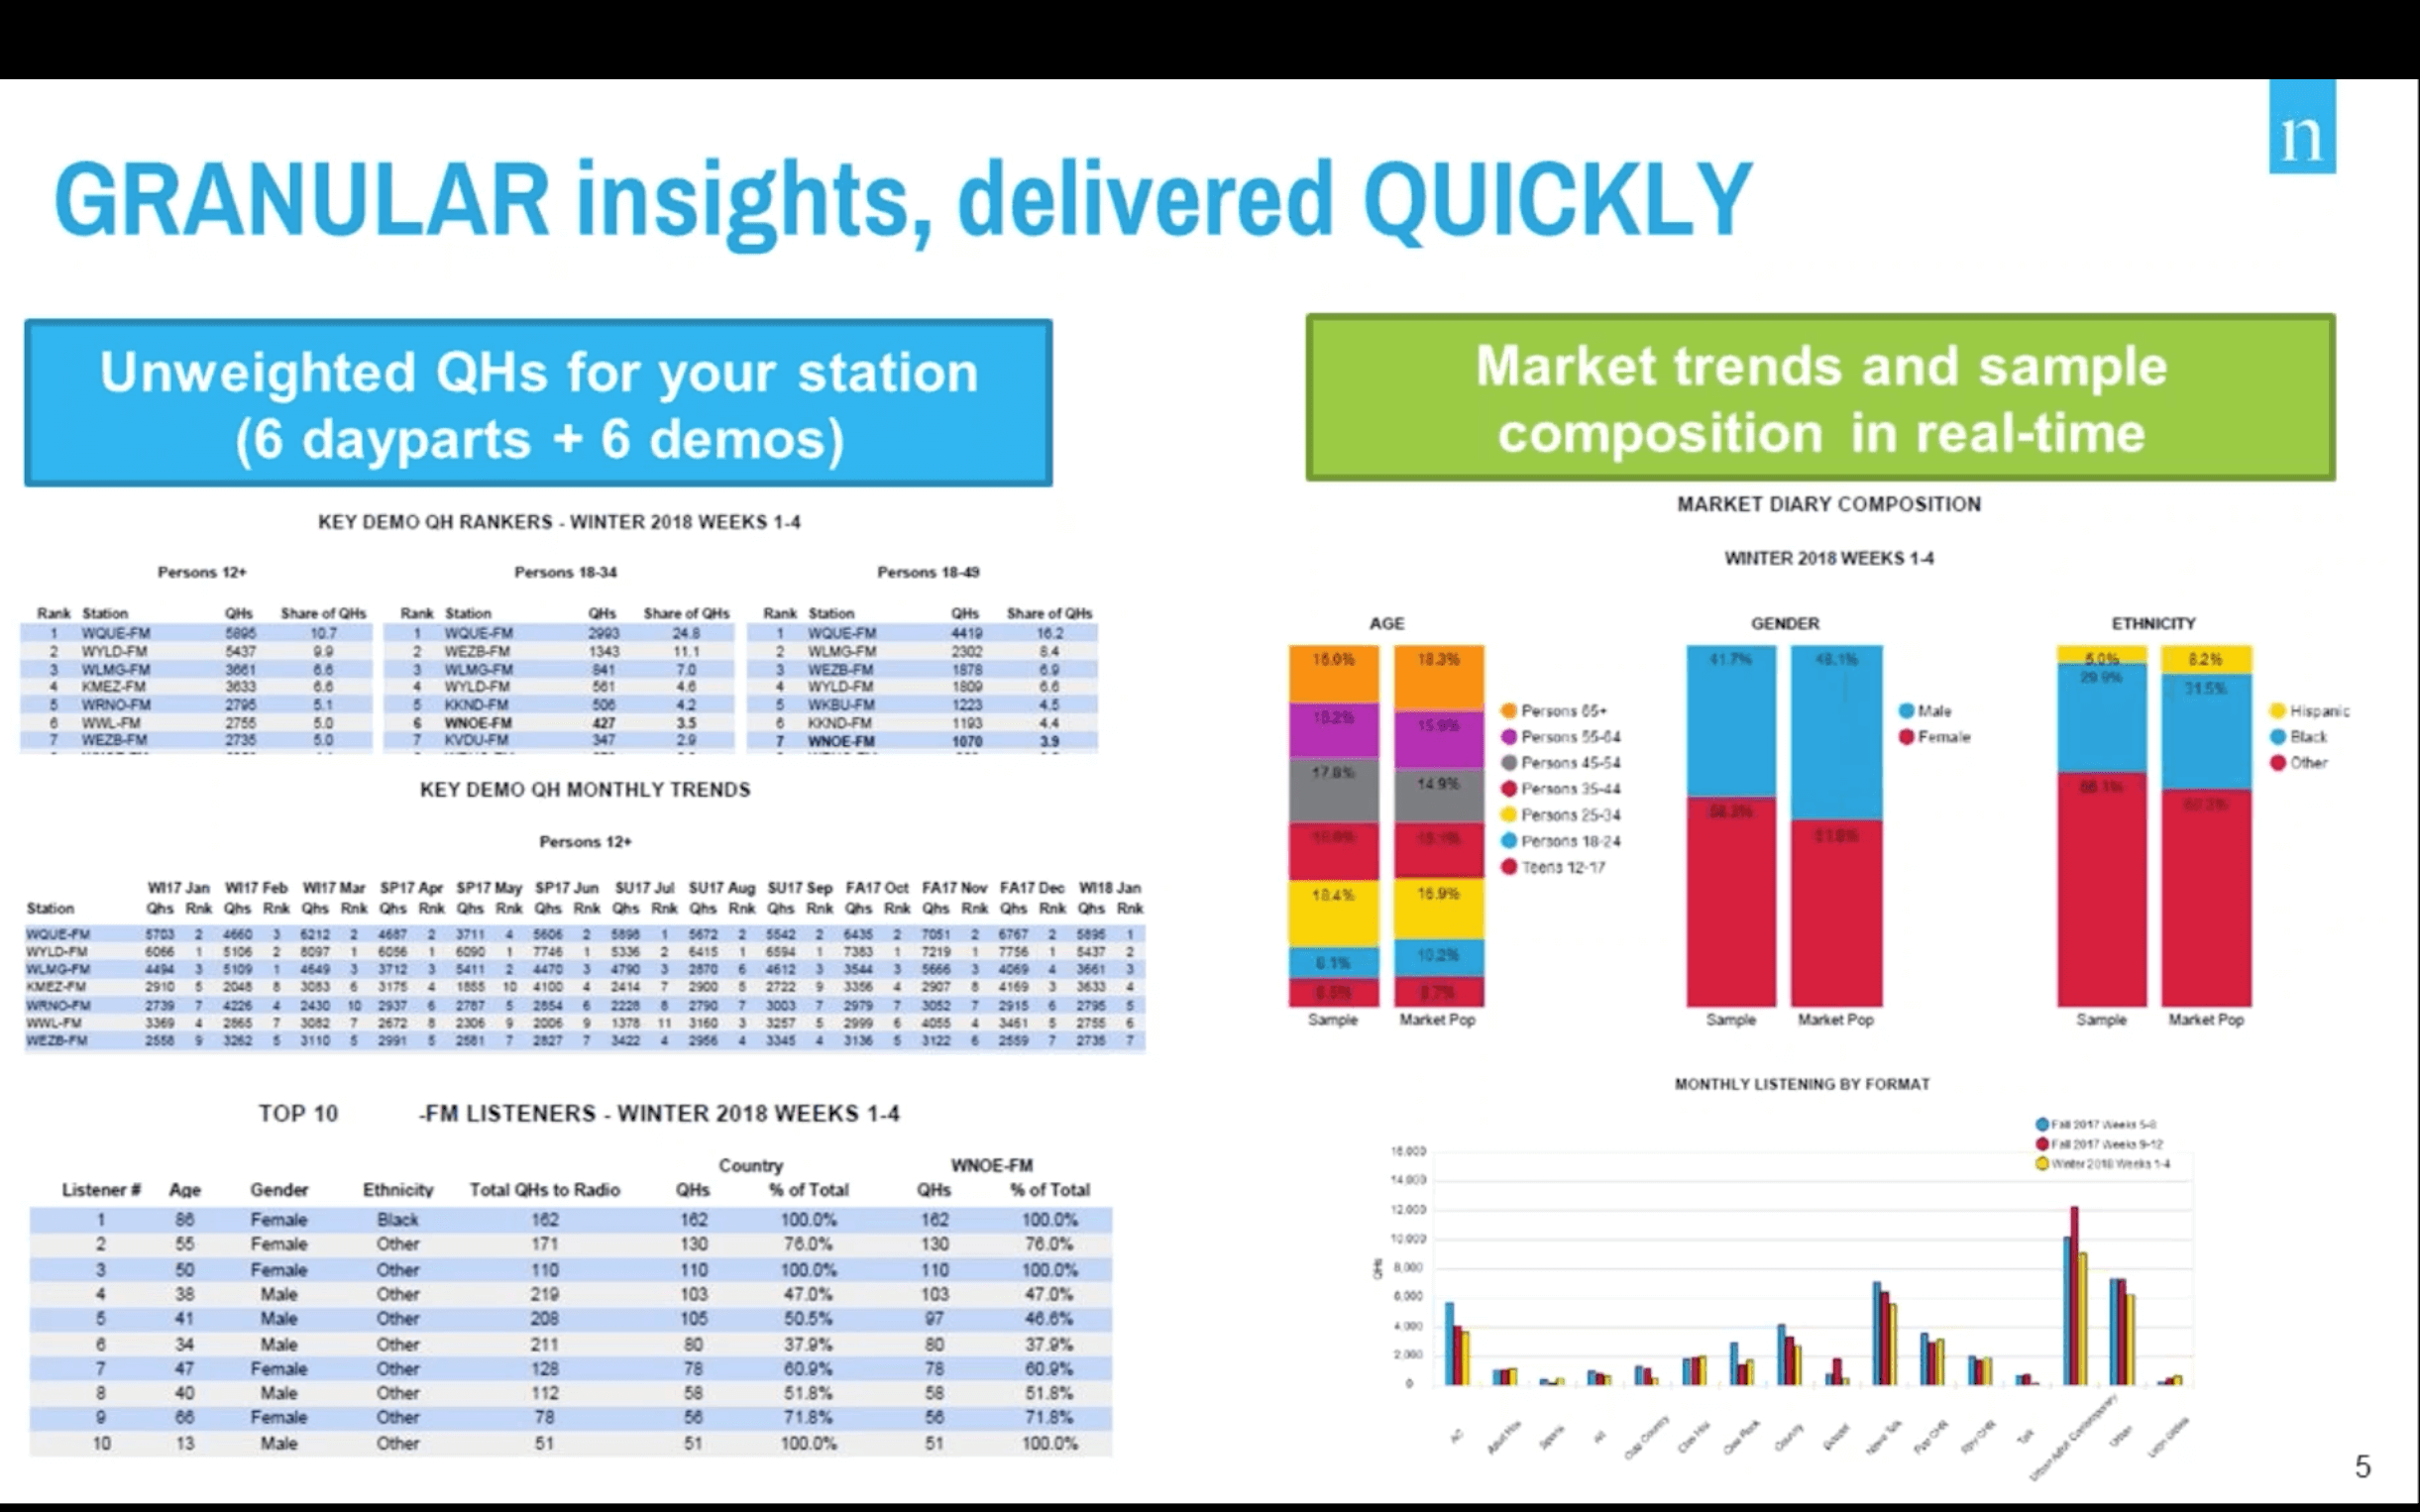
One of the great additions is the ability to see what’s going on in the market and how that may have had an impact on individual station monthlies.
Here are examples of two these different types of reports. Those on the left (blue header) are specific station related reports while those on the right (green header) display market-wide information.

Now, here’s a more specific look at a station report – in this case the “100 quarter-hour” and Top Diary Keeper report:

And here’s a specific look at a market-wide report – in this case, the Unidentified/Satellite/Internet data:

Delivery
Diary Monthly Radio Insights launches with the current winter survey. Four-book markets will receive monthly reports which will be available a few days before the “true currency” trend report is released. Two-book markets will receive two reports per year at the conclusion of the third phase.
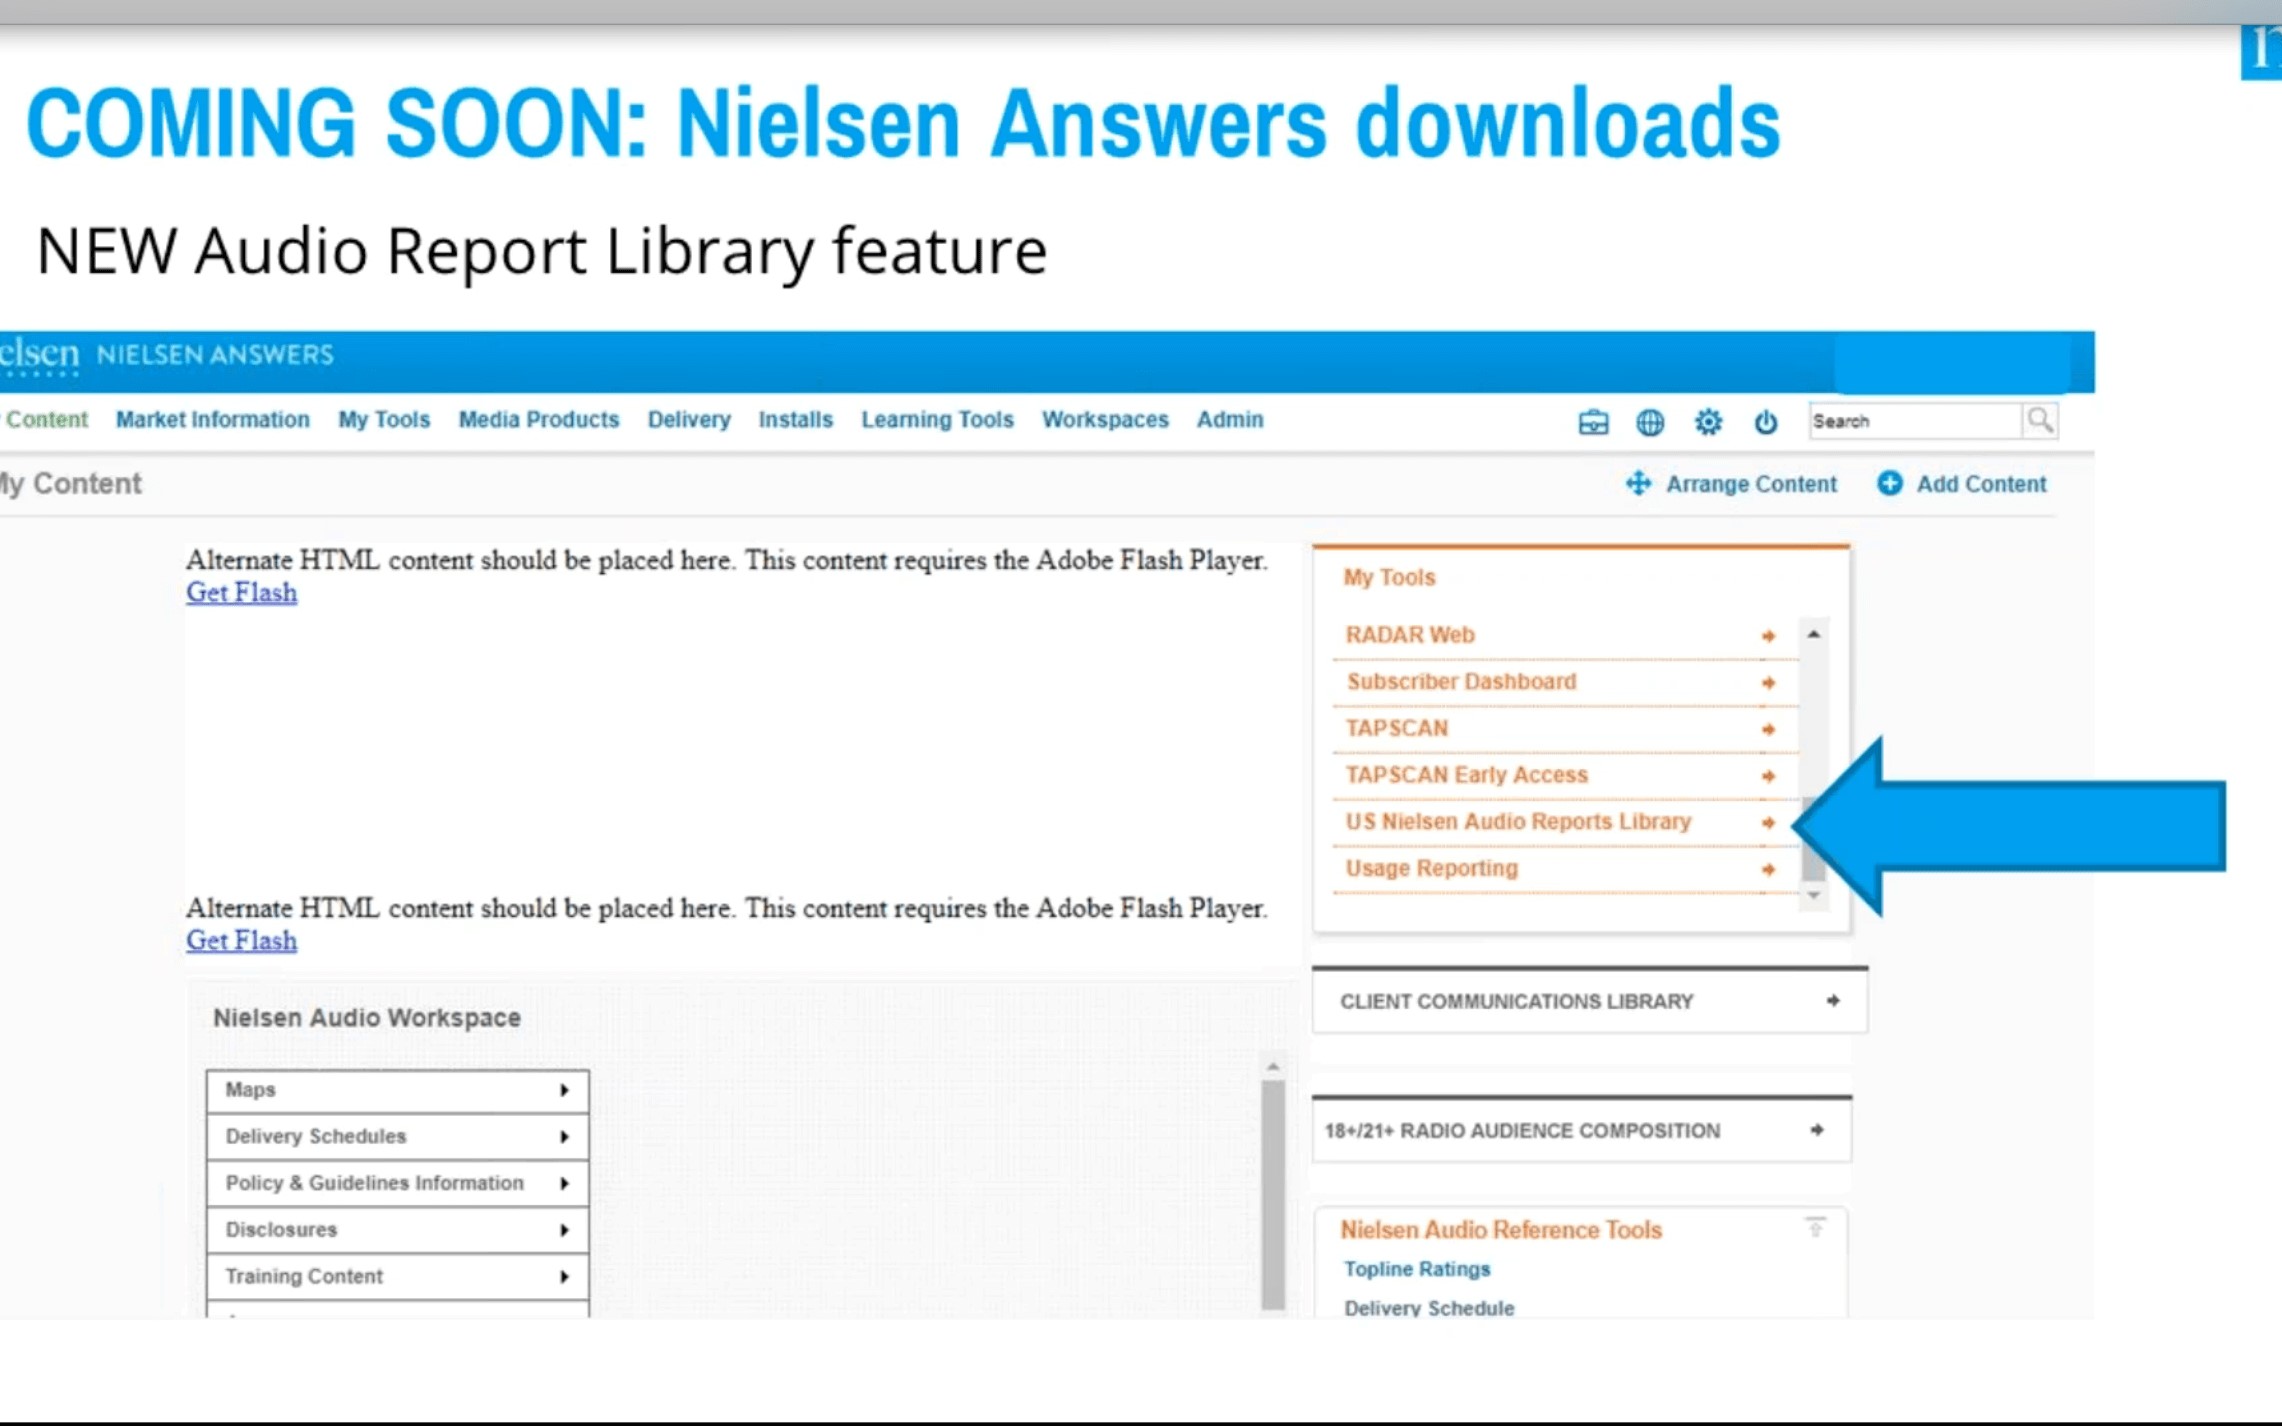
Ultimately the reports will be available for download here on the answers.nielsen.com page.

If your station/cluster is already a subscriber to PD Advantage and Arbitrends, there will be no extra charge for the reports.
The Bottom Line
At A&O&B we’re all about knowing as much as possible when it comes to ratings. That especially includes as complete an understanding as possible of the factors that are driving monthlies and quarterlies.
Up until now, monthly trends have always left me with more unknown variables than I’d like. Sample proportionality, 100+ QHR users, geographic returns, and what might be behind a format’s (or formats in a station’s sharing environment) monthly performance were all metrics that could have potentially impacted the monthly. But was hard to know which if any of these could have been a factor simply because there was not enough granular data revealed to get a clear picture.
But Diary Radio Monthly Insights changes this by providing a deep dive into all these areas. These new reports fill in a number of informational gaps that we have been attempting to estimate with extrapolation formulas.
Having access to real data rather than extrapolations to work with is huge. And so is the level of granularity.
As of today, in many markets, the monthly trend information gap just got a lot smaller.
Want to have a ratings conversation? Reach Mike here
You can watch the Nielsen Diary Monthly Ratings Insights webinar hosted by Jon Miller, VP, Audience Insights here
Read A&O&B’s report on Format Trends for 2018 here
Read about Country’s seasonal trends here and here
Get in touch with Nielsen here
Copyright: <a href=’https://www.123rf.com/profile_bennian’>bennian / 123RF Stock Photo</a>
